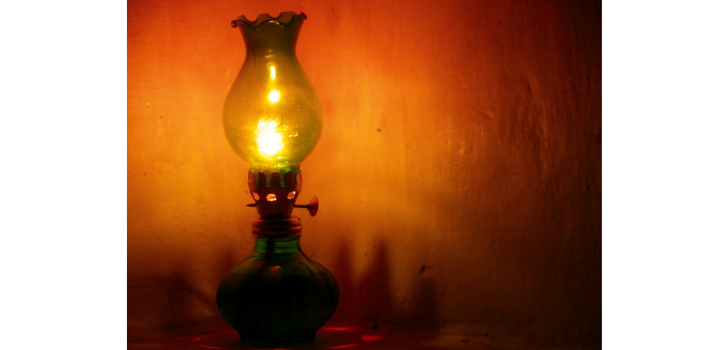
Alternative Fuels and Lighting For When The SHTF, by Tractorguy
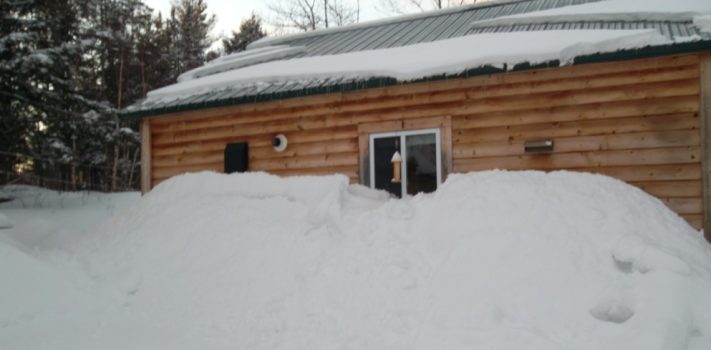
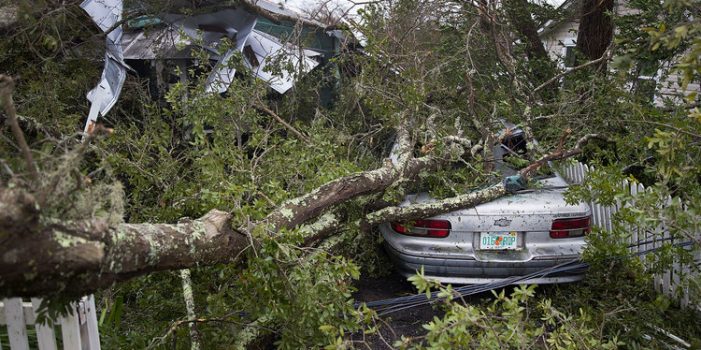
Something that we always stress to fellow preppers, is that “when the SHTF, what you have is all you will have,” stressing the importance of permanently sustainable and renewable things like wood heat, electricity from solar panels, etc. Once you have that covered, however, it is worthwhile to consider that some of the disaster scenarios we may have to cope with may be temporary – whether a weather event such as a snowstorm or tornado, or something medium-term like an EMP event affecting a smaller town where the residents are likely to pull together and survive. A limited-supply fuel may …