


Editor’s Introductory Note: This analysis was published by our friend Hub Moolman on January 20th, 2026. There is a wide range of opinion amongst precious metals market analysts on where the top might be for silver, in the current cycle. I personally expect to see a top somewhere between $125 and $195 per ounce. The bull market will probably be stopped by the combined force of legislation, executive orders, central bank intervention, and radically increased margin requirements by the metals exchanges. Presently, Asian silver buyers are unperturbed by the recent COMEX and LBMA trading rules changes. But when it comes, the PRC government’s draconian intervention will surely have a profound effect. I urge SurvivalBlog readers to cover their costs by gradually divesting as this spike continues. Anyone who bought their silver at below $31 per ounce should have already divested 20% or more of their stack, and put the proceeds into other tangibles. I must also reiterate: Always maintain a core holding of small silver coins (nothing larger than 1 ounce) to be able to barter for necessities. That should be at least 30% of your silver stack.
—
Even at close to $100 an ounce today, silver is still a must-buy. Here is why:
1. Silver vs The Quantity of US Dollars
Buying silver today with US dollars is a lot like buying silver in 1972. Below is a chart that shows the silver price relative to the monetary base (currency in circulation plus reserve balances):
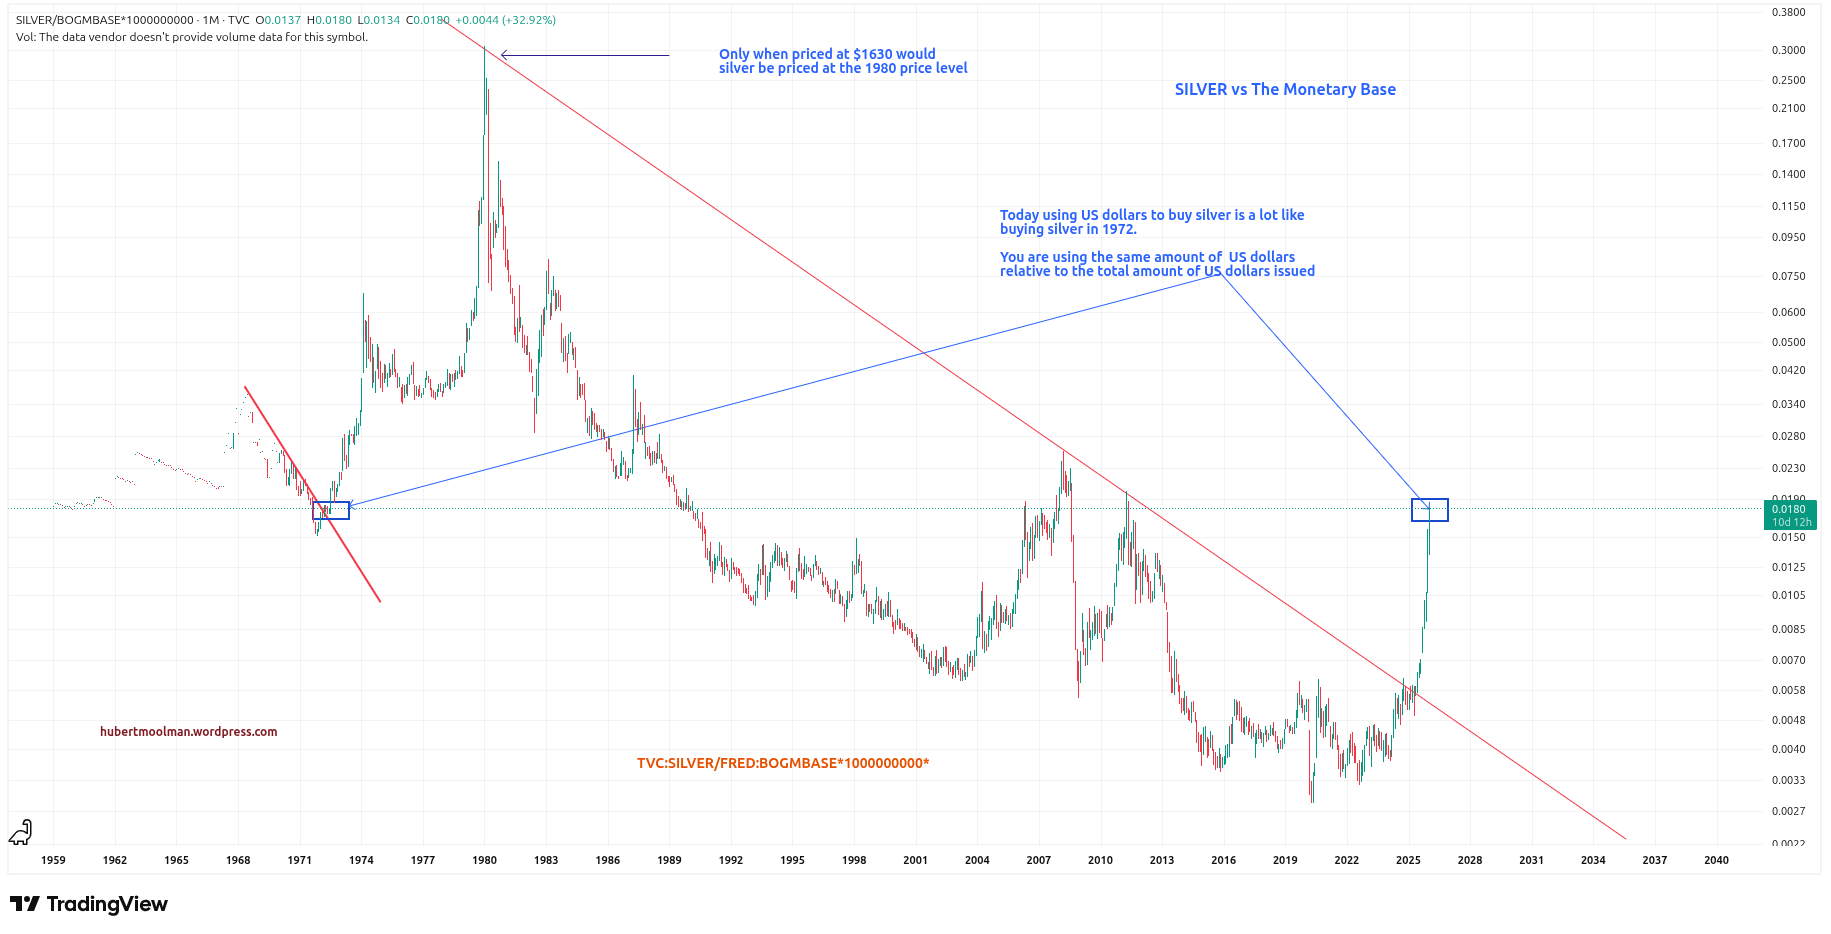
When buying an ounce of silver today, you are using the same amount of US dollars relative to the total amount issued (according to the FED) as you would have circa 1972.
Only at around $1,630 per ounce (today) would silver be priced at the 1980 high, relative to total US dollars issued.
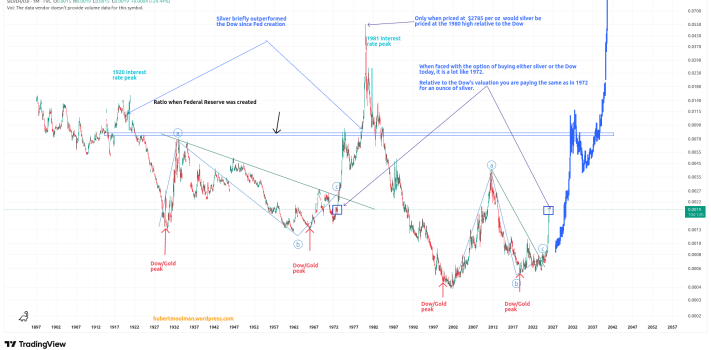
2. Silver vs Dow
Since the creation of the Federal Reserve, the Dow Jones has significantly outperformed silver.
It was only during brief periods before the 1919 and 1980 silver peaks that silver was able to outperform the Dow (see the Dow/Silver chart below).
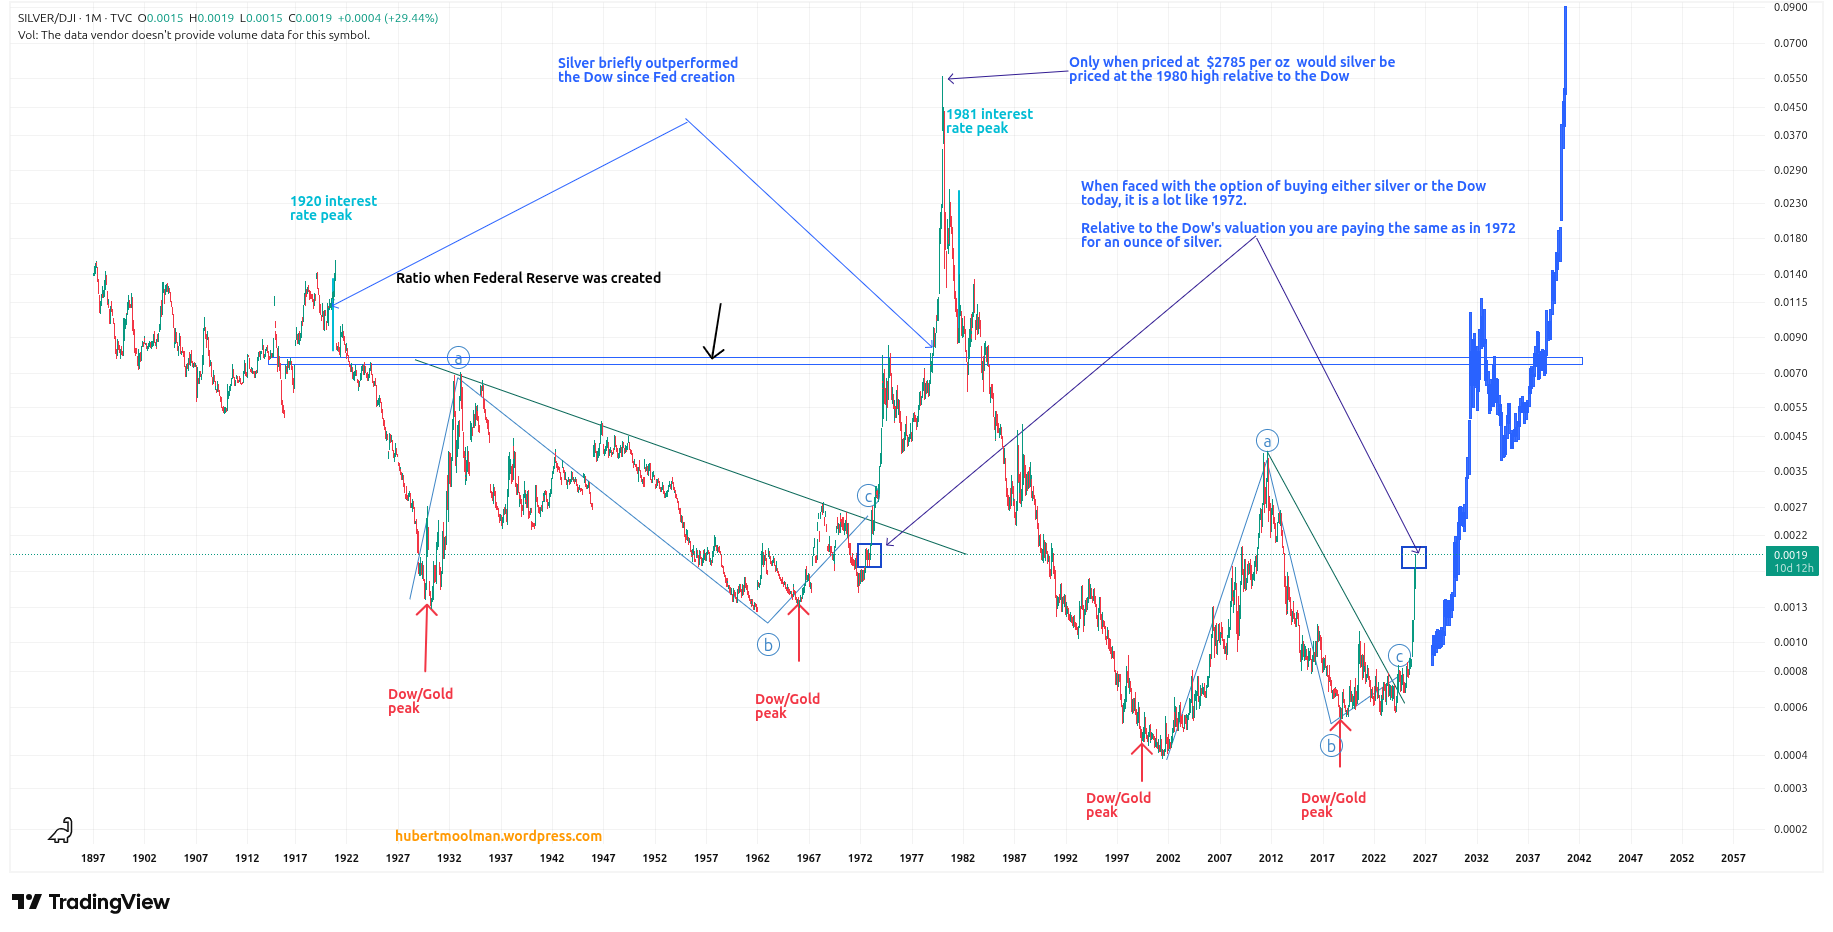
The Dow/Silver ratio needs to rise above the double blue line in order to reach parity with the Dow since the creation of the Federal Reserve. In current prices, that would mean silver’s price needs to be way above $300.
Note that the FED, by way of its money creation, first benefits the stock market, and then only at the end of that cycle do assets like silver and gold catch up and ultimately outperform (more detail here).
We are now in that catch-up phase. Relative to the Dow, silver is still historically very cheap. When faced with the option of buying either silver or the Dow today, it is a lot like 1972. Relative to the Dow’s valuation, you are paying the same as in 1972 for an ounce of silver.
Only when priced at $2,785 per ounce would silver be priced at the 1980 high in terms of the Dow.
3. Still relatively early in this bull market
The current setup on the silver chart is a lot like the start of the silver bull market of the early 2000s. In those days silver was under $6 and considered cheap.
The current bottoming pattern from around 2014 to now is very similar to the early 2000s bottoming pattern (see the chart below).
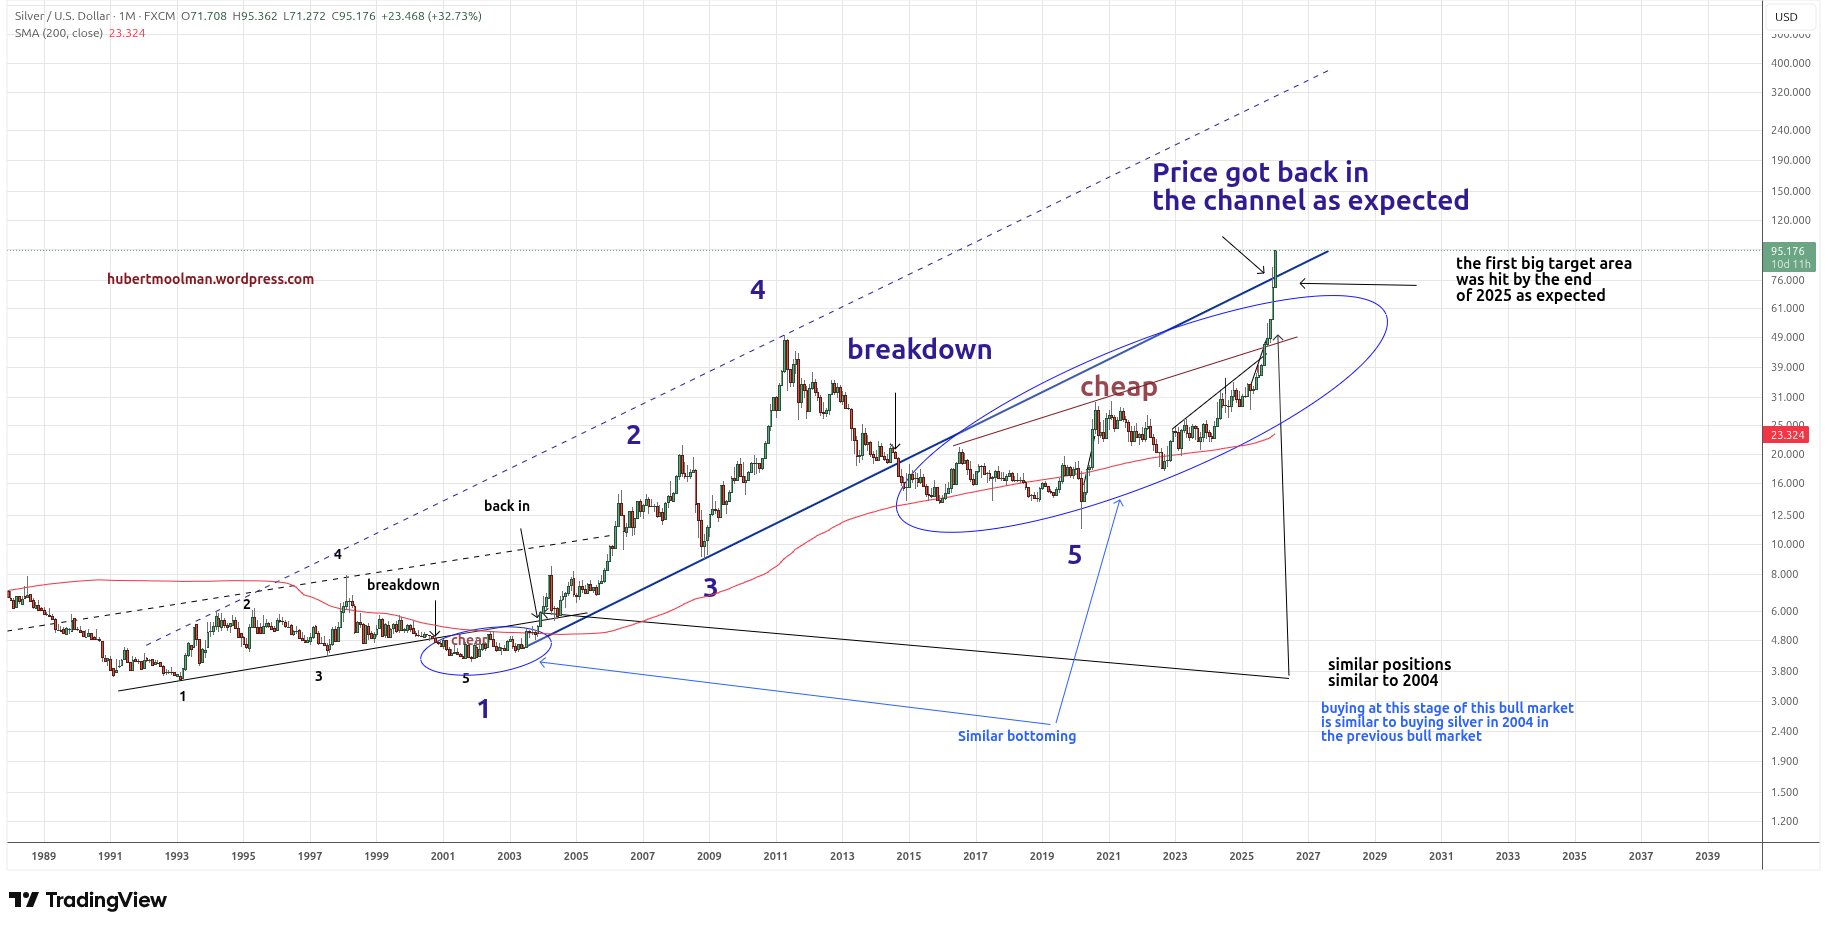
Find more detail on the chart here. I have indicated how the current chart position is similar to circa 2004, when prices were still around $6. 2004 was still very early in the bull market, an excellent time to buy. Buying at the current levels (given the above) presents equally great value.
—
Editor’s Closing Note: This article first appeared at Hub Moolman’s website. It is re-posted with permission. By subscription, he also has a premium service. I recommended both of them. – JWR