


Gold is one of the most reliable and accurate financial measures one can use. Historically, the Dow/gold ratio has provided a very good signal for silver bear and bull market cycles.
Here is a long-term silver chart compared to a long-term Dow/gold ratio chart:
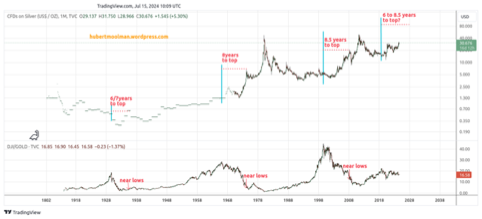
On the silver chart (the top trace in the chart), I’ve highlighted the significant Dow/gold ratio peaks with a blue line. In every case, silver made a significant bottom some years after the Dow/gold ratio peak. These were signals for the (then-coming) silver bull market.
Once in the bull market, significant silver peaks occurred within 8.5 years, as measured from the Dow/gold ratio peak (marked in red), with the Great Depression silver peak occurring the soonest (6 to 7 years after).
In October of this year, it will be six years since the Dow/gold ratio peak. That’s when we’ll be entering a phase where an interim peak becomes probable, but not before some big rallies manifest.
The takeaway from this should be that we are close to a period where massive (sustained) silver rallies will likely occur, seeing that the best rallies are often near the peaks and that silver actually rallied on a sustained basis for at least two years before each of those peaks.
Each of the silver peaks (indicated) was nearer the bottom of the Dow/gold ratio. The current level of the ratio is still closer to the 2018 peak, so it still has some way to go. Again, this means that the best rallies are still ahead.
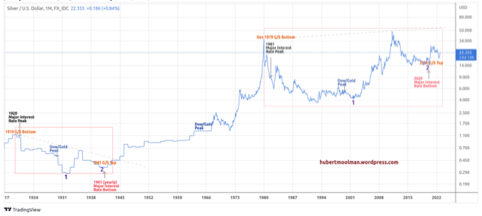
This is even more interesting (not always in a good way) when considering that we are probably very close to monetary reform:
—
About The Author: Hubert Moolman is a precious metals analyst based in South Africa. He offers a premium service as well as a private blog that provides more insights into the gold and silver markets.