


DISCLAIMERS: I am not an investment professional and not licensed to handle investments for others. This article and these statements are not your investing advice, nor your tax advice. The results determined in this 9-year period will almost certainly not apply to other periods! This is just what happened; it does not predict the future. Your mileage may vary! The opinions presented in the discussion are mine and may or may not be correct.
INTRODUCTION
In 2015, I proposed a model prepper investment portfolio attempting to follow Solomon’s investing advice, from the book of Ecclesiastes. Solomon stated that humans can not even know what misfortune may come upon the land, and as a result should “divide their portion to seven or eight.” (In other words, diversify your investing.)
Back then, I suggested eleven areas for “prepper” style investments, including one’s home, rental housing, precious metals, firearms, ammunition and “paper” investment in domestic and foreign (stocks of ) companies. The best result would likely occur from re-balancing these investments at approximately yearly intervals — but I have not invested the time to do so. Thus, the returns listed here are not as great as they normally would be for a prudent and responsible investor.
Note that the model portfolio was more for learning and education, than for any real investing. My wife and I do not enjoy the benefits of any pension, so to supplement our Social Security income, we are dependent on my wits as an investor, and my investments follow the general outlines of the Christian investing teachers at soundmindinvesting.com — a diversified mix of large, small, foreign and bond/money market funds and ETFs. God has blessed us far beyond our expectations and we are able to thrive and serve others through teaching and giving as a result of my investment returns.
Further, this is an idealized “index” and does not address the various methods of holdings, such as Roth IRA, which might have significant tax advantages. What this model portfolio does provide, is an objective look at how various investments that are widely discussed in prepper “circles” have performed over the last nine years.
How the Index was Constructed
In the beginning, the original market price of each sector was located, and a mathematical weighting (a multiplier) applied so that $90.91 was virtually invested in each of the 11 areas, resulting in a total investment of $1000. The results (of course) can be scaled up or down to fit whatever investments one wishes to make. To evaluate the 9-year performance, the exact same multiplier weighting was applied to the market values of each sector’s value in early July, 2024.
The sectors of the model portfolio are given in Table One:
Table One: Sector Components of a Model Portfolio
| Sector [U.S. based] | Method of Finding Current Value |
| Domestic large cap stocks | Vanguard 500 Index Fund VFIAX [1] |
| Domestic small cap stocks | Vanguard Small Cap Index Fund VSMAX [2] |
| Foreign stocks | Vanguard All World Ex-US Fund VFWAX [3] |
| Precious metals mining funds | Fidelity Select Gold FSAGX [4] |
| Rental Housing | A combination of an estimate of property appreciation and rental income: ½ of the median sales price of existing homes [8] + the accrued rental income calculated by (Consumer price index: Rent of primary residence [5]) * number of months since last re-balancing). (This is a crude measure of potential rental housing income.) |
| REIT (real estate investment trust) | Vanguard REIT Index VGSIX [6] |
| Precious metals | Gold spot price + 15 x silver spot price [7] |
| House | Median sales price of existing homes, St. Louis FED [8] |
| Firearms | Entry level AR-10 rifle on Bud’s Gun Shop, cash price [9] |
| Ammunition | Lowest-priced 1000 rounds of brass-cased bulk AR15 ammo from Lucky Gunner [10] |
| Money market fund | Vanguard VMMXX, initial investment $90.91 + return calculated as 1 year interest minus expense ratio (I replaced this with an estimate of 3% annual return, which may be a bit high) |
RESULTS
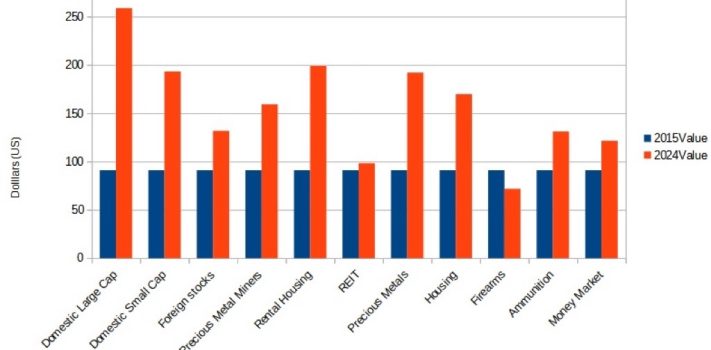
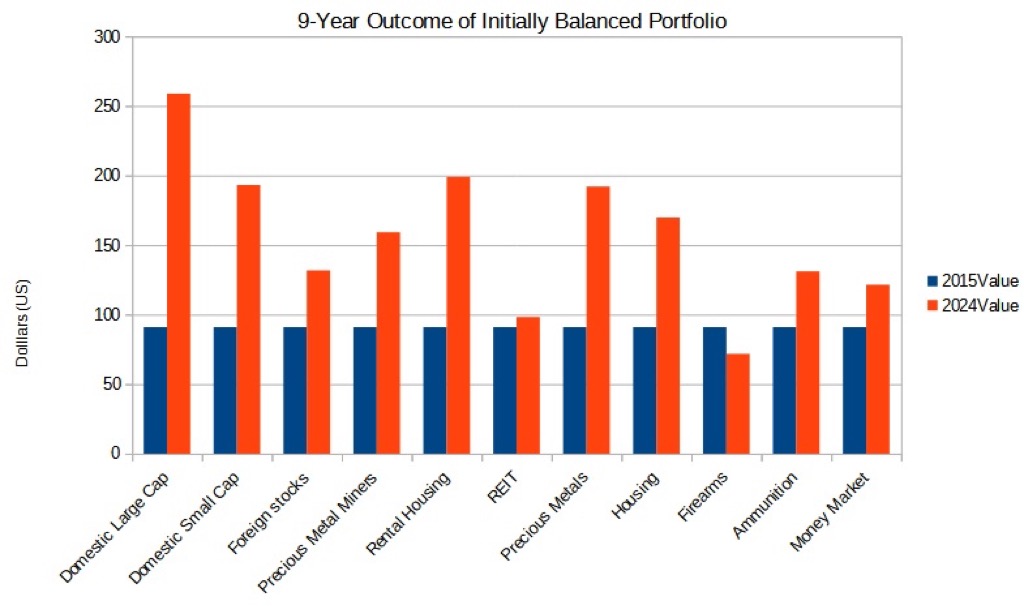
The following table and bar chart both show how these sectors fared over the 9-year period (without any re-balancing, and to the best of my ability to measure; see notes following). In each case, the actual value obtained from the published data point for the sector has been multiplied by the original weighting used in 2015. (A table of these weightings is provided at the end.)
|
Sector Name |
Original Weighting of Benchmark Data |
2015 Value |
July 4 2024 value |
2024 Value |
|
Domestic Large Cap |
0.5066 |
$90.91 |
510.85 |
$258.80 |
|
Domestic Small Cap |
1.8524 |
$90.91 |
104.24 |
$193.09 |
|
Foreign stocks |
3.5574 |
$90.91 |
37.02 |
$131.69 |
|
Precious Metal Miners |
6.4867 |
$90.91 |
24.54 |
$159.18 |
|
Rental Housing |
0.0008036 |
$90.91 |
247579.06 |
$198.95 |
|
REIT |
3.5463 |
$90.91 |
27.71 |
$98.27 |
|
Precious Metals |
0.06811 |
$90.91 |
2818.78 |
$191.99 |
|
Housing |
0.000405 |
$90.91 |
419300 |
$169.82 |
|
Firearms |
0.0793963 |
$90.91 |
901.99 |
$71.61 |
|
Ammunition |
0.2758359 |
$90.91 |
475 |
$131.02 |
|
Money Market |
1.0217676 |
$90.91 |
118.87 |
$121.46 |
|
Totals |
$1,000.01 |
$1,725.90 |
NOTES:
- For rental housing, in addition to the 50% of the gain in average housing value, I assumed an average of the government-reported indexed income for the nine years. This is a very crude measurement, with relatively LOW indexed rental income, but offsetting this is that no repair costs or taxes were assumed.
- For Money Market, apparently the original fund has been replaced, so I assumed an average of 3%.
- None of the DIVIDENDS were included for the stock funds; including these would substantially increase the gains of those sectors.
The overall nominal (nominal = valued in inflated dollars) gain of the prepper index over 9 years was 72.5% The four highest gaining sectors were: Large Cap Stocks, Rental Housing, Precious Metals and Small Cap Stocks. The four with the lowest returns were: Firearms, REIT, Money Market, and Ammunition; two of those actually lost money.
DISCUSSION
One’s evaluation of financial results is always colored by internal biases, and certainly also by the time frame and world events of the period. Thus my observations are not unbiased.
Of all the sectors, clearly, Large Cap Domestic Stocks had the best run during this period, with a GAIN of 174.6% (ending at 274.6% of original virtual investment). Domestic Small Caps also did well, while over this period Foreign stocks didn’t do as well. Stock valuations are often said to represent the investing community’s estimation of the future earnings capacity of companies. Very large indexes like these average out the bumps and peaks of individual companies’ good and bad years, but of course there are overall good years and then there are bad years (like the recession of 2010). Many of us believe that stocks are, and have been, overpriced….and yet they keep going up! There is an old saying that the market can remain irrational longer than you can remain solvent! Favored is the investor who is able to capitalize on the irrational gains of a market, and choose wisely when to withdraw. In my case, I almost always withdraw prematurely and miss some gains. Oh, well.
REIT (real estate investment trusts) did terribly. If these results were adjusted for inflation, one would certainly have lost money.
Precious Metals (gold and silver) did well, just not as well as the better stock categories. I’m always amazed that the precious metal companies advertise so much when their valuations are HIGH — of course this is when less-well-informed investors will buy (at a peak) and then may have lesser returns as valuations return to the mean. (The same is undoubtedly true of stocks: I prefer to buy during a CRASH!) Precious metals themselves did better than the Miners of the metals (if you were not re-balancing). Avoid buying “high” and selling “low” (usually driven by panic emotions).
The “firearms” category was represented by a single AR-10 type firearm and may not be representative of other categories or the area as a whole — but it was easy to measure! I was very surprised that there were actually losses. (And in this case, I personally have real losses for my holdings, but I’m still very happy with my tangible firearms holdings!)
Adjusting for Inflation
The results quoted above do not take the eroding impact of relentless US inflation into account. In July of 2015, when this index was constructed, the reported consumer price index was 238.65; the latest data available in 2024 is 314.07, reflecting an increase of 31.6%. Thus the total nominal gain of the index (72.6%) is actually only a real gain (when adjusted for inflation) of 31.1%. At least it kept up with inflation and actually turned a real gain! A little math shows this is a real gain of about 3% (above inflation) per year. Normally, investment portfolios for retirement aim for a nominal gain of more like 7-9%, and a real gain (minus inflation) of 3-5%. So our prepper portfolio was in the lower side of what is desirable if you need income to live on. But results would have likely been much better if re-balanced every year or so!
It is important to realize that not all valuable investments’ purpose is income. My own (extensive) personal investments in firearms, ammunition, reloading equipment, water supply, food supply, and precious metals are not for income production; rather they are insurance against bad things. You are normally expected to pay for insurance, not make money from it. And as such these tangible items are quite valuable, even though I realize insignificant amounts of “cash” from them.
Investing Profits In Tangibles
Investors who, like me, want to have insurance in the tangible form of firearms, ammunition, survival assets, etc., might do as I have and take profits in stock funds, convert them to cash, and use them to bolster the tangible assets that are more for insurance, than income provision.
In fact, for real investors who need to live off of their earnings, it is difficult without being an FFL to capitalize significantly on some of these categories (that is, get actual cash gains that can be spent on necessities). Further, for people above subsistence level, it is difficult to have enough invested even then to have a sufficient income for “food costs, taxes and spending money.” Think of trying to invest $10,000 in ammunition to potentially clear $500 per year for food. That might be difficult…
As a result of those practical issues, many of us make our primary “spending money” in the stock, bond, and money market arenas, and not in firearms and ammunition. Others do well with rental properties. With the United States so incredibly far in debt, and interest rates possibly needing to stay “higher for longer” to combat the inflation caused by so much money printing to monetize the government’s debts…..bond mutual funds have not been a very good investment for some years now and were not included in this virtual prepper index. They may become a better investment at some point, but most investment pros recommend a healthy component of investing in “going concerns” (i.e. stocks of real companies) and this has certainly done me exceedingly well.
My own actual returns in this same period, investing in a mix of stocks, some bonds, and money markets, were far greater than that shown by this index; this results from learning from experience and re-balancing occasionally and recognizing the obvious signs of impending doom (for example, in the bond market when interest rates had nowhere to go but up).
Mathematical Weightings:
-
Sector [U.S. based] Weighting chosen in 2015 such that the sum of index starts at $1000.00 Domestic large cap stocks 0.466 Domestic small cap stocks 1.56 Foreign stocks 3.01 Precious metals mining funds 6.84 Rental Housing 0.00077 REIT (real estate investment trust) 3.48 Precious metals 0.069 House 0.00038 Firearms 0.105 Ammunition 0.275 Money market fund (Start with $90.91)
REFERENCES:
[1] Yesterday’s value can be found by searching for VFIAX at https://www.marketwatch.com/
[2] Yesterday’s value can be found by searching for VSMAX at https://www.marketwatch.com/
[3] Yesterday’s value can be found by searching for VFWAX at https://www.marketwatch.com/
[4] Yesterday’s value can be found by searching for FSAGX at https://www.marketwatch.com/
[5] Indexed rent from primary residence at: https://research.stlouisfed.org/fred2/series/CUUR0000SEHA
[6] Yesterday’s value can be found by searching for VGSIX at https://www.marketwatch.com/
[7] Spot prices at closing time: http://www.cmi-gold-silver.com/gold-silver-daily-spot-prices/
[8] https://research.stlouisfed.org/fred2/series/HOSMEDUSM052N
[10] www.luckygunner.com
[11] The original fund appears to have been discontinued.