
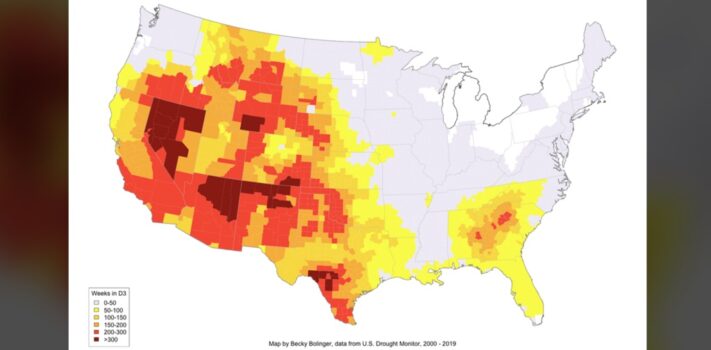


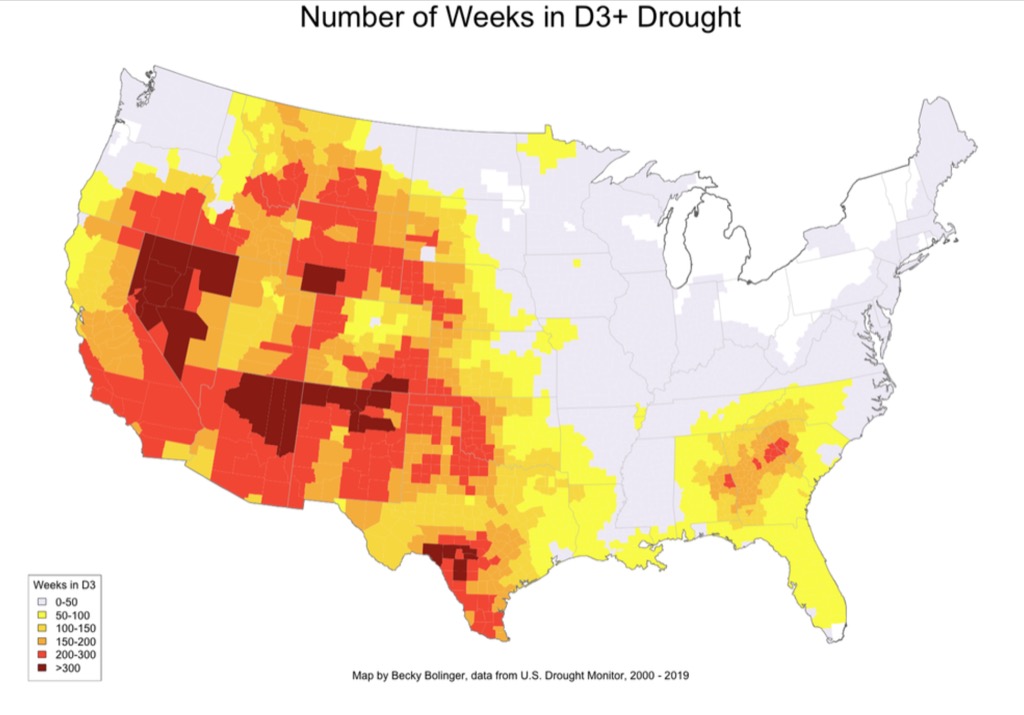
Today’s graphic is a map that shows U.S. counties by the number of weeks experiencing extreme drought, as of mid-July, 2026. (Graphic courtesy of Reddit.)
The thumbnail image below is click-expandable.
—
If any SurvivalBlog readers have personally taken or otherwise hold the copyright to a particularly nice landscape photo or other photo of particular interest to preppers that is in a wide horizontal format (to match our blog template) then please send it in as an e-mail attachment, and I will consider posting it as a Graphic of the Week, or as a Top Note photo. I can of course credit you by name — or pen name — if you’d like. Many Thanks! – JWR. (Either via e-mail or via our Contact form.) Any graphics that you send must either be your own creation, under your copyright or uncopyrighted in the public domain. Thanks! – JWR