
Email a copy of 'Economics & Investing For Preppers' to a friend
One Comment
- Ad Prepare for chaos with the essential SIEGE belt. Perfected for CCW with flexible, no-stretch, high-grip custom HD ballistic nylon and capabilities unmatched in any other belt. Go anywhere. Solid 5.5-7 oz of persuasion has saved many. Save $20!SIEGE STOVES: in a fuel crisis twigs are free and abundant. Ultra-compact high-performance portable survival stoves. Enter "SBLOG" at checkout for $20 off any belt. USA-made.
- Ad SurvivalRealty.com: Sell Your Remote LandAdvertise your hard-to-sell remote land to eager buters. We specialize in rural, remote, and off-grid properties worldwide. Affordable ads. No commissions are charged!
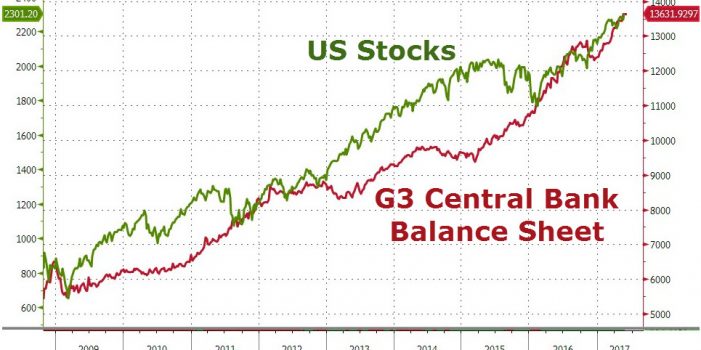
Re the chart of bank buying. The 1920’s charts are making the rounds again. The correlation to the top in ’29 is being eyed by many. I will say that in 2016 the market looked topy and the same correlation was pointed at by many and not just doomsdayers but ‘pros’ on Wall Street. Well, 2018’s, toppiness looks similar to both 2016 and the 1920’s. There is a difference, no QE and no ZIRP this time like there was in ’16. But, the economy is perceived to be going well so it might not be the end of the current run higher. It’s always tricky during long flat periods in the market. Which way will it break, higher or lower?