Today’s graphic: Firewood Supply Versus Demand. (Graphic courtesy of Reddit [1]. Map by Casey Peterson, based on 2021 PRISM OSU climate data.)
The thumbnail below is click-expandable.
 [2]
[2]
—
From the Reddit site:
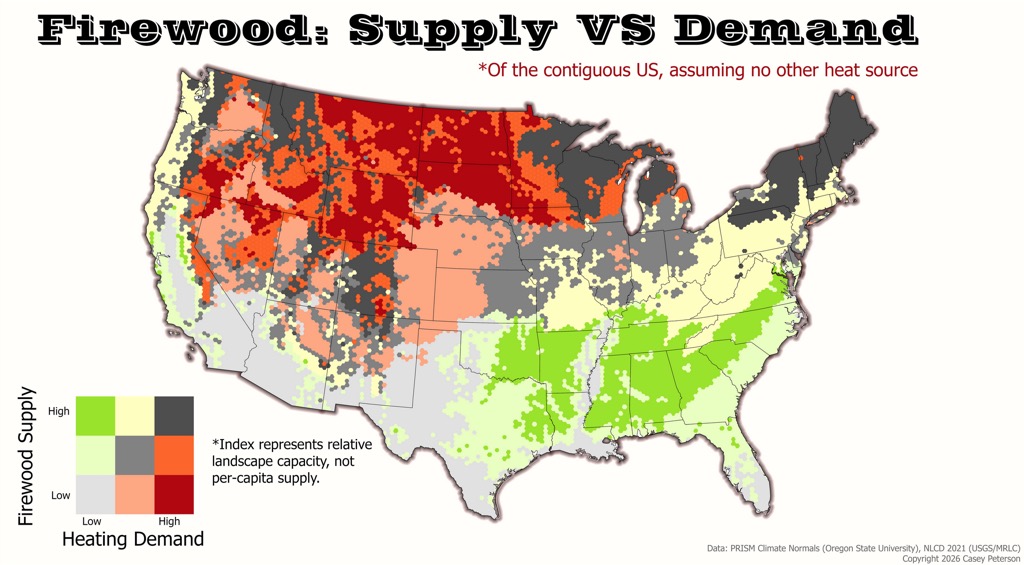
Heating demand is approximated using a Heating Degree Day proxy derived from PRISM 30-year mean annual temperature. The formula max(0, (18.3 - Tmean) * 365) estimates how much heating a location needs annually – 18.3°C (65°F) is the standard base temperature below which buildings require heating. Higher values mean colder climates with greater heating needs. This is a simplified annual approximation; true HDD uses daily temperatures, but the relative ranking between cells holds at this scale.
Firewood supply is a weighted index of forest cover from NLCD 2021 land cover classification. Deciduous forest (NLCD class 41) is weighted at 1.0 since hardwoods like oak and hickory produce significantly more heat per cord than softwoods. Mixed forest (class 43) is weighted at 0.7 and evergreen/conifer forest (class 42) at 0.4. The result is a single value representing the relative firewood resource available in each cell, accounting for both the amount of forest and its quality as fuel.
Each cell is ~250 sq miles
DISCLAIMER: The analysis doesn’t account for number of people at all – it’s a purely landscape-level ratio of “how much forest is here” relative to “how cold is it here.” It’s not calibrated to any specific number of people, cord consumption rates, or sustainable harvest yields. It’s a relative index that says “this cell has more firewood per unit of cold than that cell” – useful for ranking cells against each other, but not for answering “can 50 people actually heat their homes here.”
—
Please send your graphics or graphics links to JWR [3]. (Either via e-mail or via our Contact form [4].) Any graphics that you send must either be your own creation or uncopyrighted.