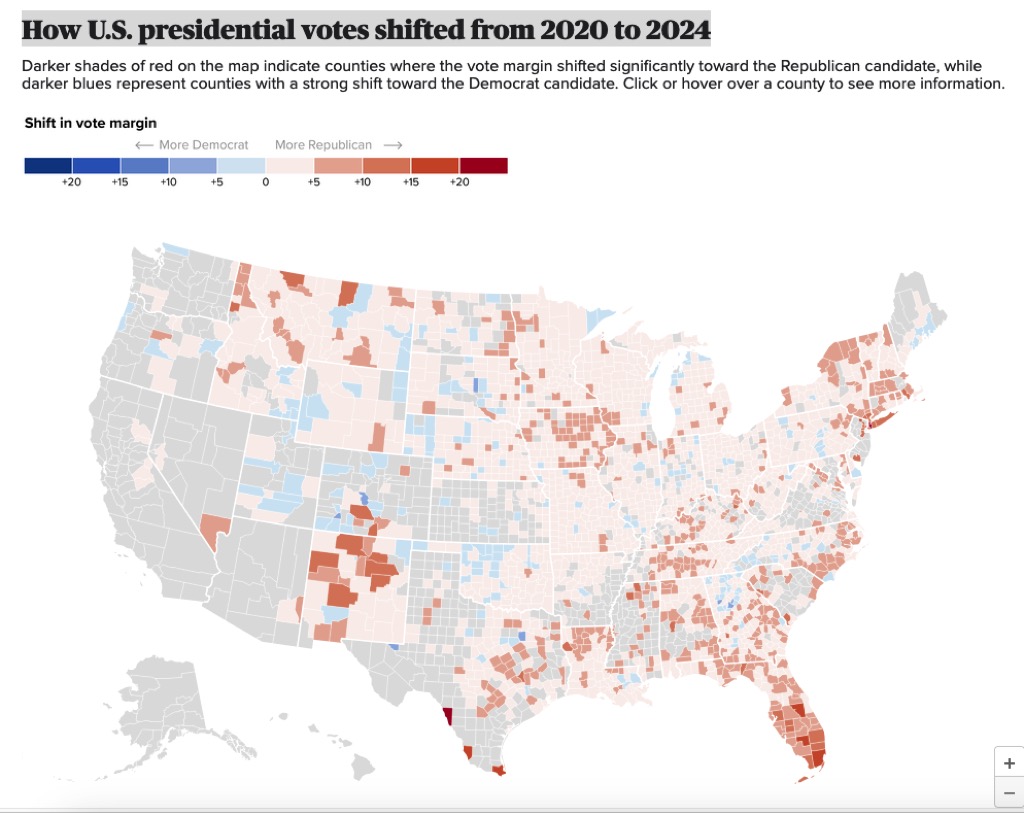
Today’s graphic: How U.S. presidential votes shifted from 2020 to 2024.
(Graphic courtesy of Graham Kates, CBS News [1]. See the CBS site for the full zoomable version of the map as well as interactive exit poll data and analysis by Graham Kates [2].)
The thumbnail below is click-expandable.
 [3]
[3]
—
Please send your graphic ideas to JWR [4]. (Either via e-mail or via our Contact form [5].) Any graphics that you send must either be your own creation or uncopyrighted.